1. Introduction & Overview
This paper presents an economic analysis of photovoltaic (PV) power plant investments in Slovakia, focusing on three distinct installed capacities: 980 kWp, 720 kWp, and 523 kWp. The analysis is conducted within the context of Slovakia's ambitious national energy strategy, which forecasts an increase in renewable energy capacity from 260 MW to approximately 2100 MW by 2030—an almost 800% growth. Historically, PV technology has been at a disadvantage in Slovakia due to high initial investment costs and relatively low system efficiency (around 14% for contemporary technologies). The study evaluates the financial viability of these projects both with and without a hypothetical 50% state subsidy, acknowledging that state support, such as feed-in tariffs, is identified as the primary enabler for large-scale PV adoption, aligning Slovakia with practices in more advanced EU member states.
2. Current Energy Market Situation in Slovakia
Slovakia's electricity generation is dominated by nuclear (58%) and thermal power plants (28%), with hydroelectric contributing 14% as of 2006. Renewable Energy Sources (RES) held a minimal share. The government's prognosis for power plant capacity development till 2030, however, outlines a significant shift.
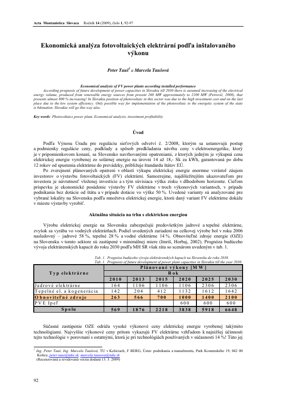
Prognosis of Power Plant Capacities in Slovakia till 2030 (MW)
Nuclear: 164 (2006) -> 2306 (2030)
Thermal & Cogeneration: 142 -> 1642
Renewable Sources: 263 -> 2100
Total: 569 -> 6648
The high levelized cost of electricity (LCOE) from PV, a consequence of its low efficiency, is its main drawback. This is counterbalanced by its clean operation (zero emissions during generation), minimal maintenance requirements (especially for static panels), and a long guaranteed lifespan of at least 25 years. The proposed regulatory measure (Decree No. 2/2008) introducing a feed-in tariff of 14-18 SKK/kWh guaranteed for 12 years is seen as a critical step towards making PV investments attractive.
3. Subject of Analysis: PV Plant Variants
The analysis focuses on three specific PV power plant investment projects with planned installed peak capacities:
- Variant A: 980 kWp
- Variant B: 720 kWp
- Variant C: 523 kWp
Each variant is assessed for selected installation sites across Slovakia, considering local solar energy gains. As per the national solar map, these gains range between 1100 and 1400 kWh/m² per year at optimal panel tilt angles. The location-specific yield is a fundamental input for the subsequent economic calculations.
4. Methodology & Economic Evaluation Framework
The core of the economic analysis revolves around calculating key financial metrics to assess investment attractiveness. The primary indicator for any investor is the Return on Investment (ROI) and the associated profit over the long-term horizon. The study evaluates two main scenarios for each plant variant:
- Business-as-usual (No Subsidy): Assumes the investment proceeds without any state financial aid.
- Subsidy Scenario (50% Grant): Assumes a state subsidy covering 50% of the initial investment cost.
5. Results & Profitability Assessment
While the PDF excerpt does not present the final numerical results, the logical conclusion is clear from the premises. Given the high upfront capital expenditure (CapEx) for PV technology and its moderate efficiency, the profitability of all three variants is critically dependent on the state subsidy.
Key Insights
- Subsidy Dependency: The 50% grant scenario is expected to transform non-viable projects into financially attractive investments, significantly improving NPV and IRR.
- Economies of Scale: The larger 980 kWp variant (Variant A) likely benefits from lower specific costs (€/kWp) compared to smaller plants, improving its economics in both scenarios.
- Location Sensitivity: Sites with higher solar gains (closer to 1400 kWh/m²) will show better financial returns than those at the lower end of the spectrum, affecting site selection priority.
- Policy Risk: The 12-year guarantee period for the feed-in tariff creates a cliff-edge risk for cash flows post-year 12, a crucial factor for long-term bankability.
6. Critical Analysis & Expert Commentary
7. Technical Details & Mathematical Formulation
The core economic evaluation hinges on calculating the Levelized Cost of Electricity (LCOE) and Net Present Value (NPV). While not explicitly detailed in the excerpt, the standard formulations applicable to this analysis are:
Levelized Cost of Electricity (LCOE): This metric represents the per-unit cost (€/kWh) of building and operating the plant over its lifetime. $$LCOE = \frac{\sum_{t=1}^{n} \frac{I_t + M_t + F_t}{(1+r)^t}}{\sum_{t=1}^{n} \frac{E_t}{(1+r)^t}}$$ Where:
- $I_t$ = Investment expenditures in year t (initial CapEx, spread if applicable)
- $M_t$ = Operations and maintenance expenditures in year t
- $F_t$ = Fuel cost (zero for PV)
- $E_t$ = Electricity generation in year t (kWh)
- $r$ = Discount rate
- $n$ = Economic lifetime of the system (e.g., 25 years)
Net Present Value (NPV): The sum of the present values of incoming and outgoing cash flows. $$NPV = \sum_{t=0}^{n} \frac{R_t - C_t}{(1+r)^t}$$ Where $R_t$ is revenue (Feed-in tariff * $E_t$) and $C_t$ is cost in period t. A positive NPV indicates a profitable investment. The 50% subsidy would directly reduce the initial $C_0$ (investment cost), dramatically boosting NPV.
Annual Energy Yield: $E_{annual} = P_{peak} \times G_{sol} \times PR$ Where $P_{peak}$ is installed peak power (kWp), $G_{sol}$ is specific solar yield (kWh/kWp/year, derived from the map), and $PR$ is the Performance Ratio (accounting for losses, typically 0.75-0.85).
8. Analysis Framework: A Practical Case Example
Scenario: Evaluating a 720 kWp (Variant B) plant in a location with a solar gain of 1250 kWh/kWp/year.
Assumptions (Illustrative):
- Total Installed Cost (CapEx): €1,200,000 (≈ €1,667/kWp, reflecting 2009 costs).
- Subsidy: 50% grant → Net Investor Cost: €600,000.
- Feed-in Tariff: €0.45/kWh (converted from 14 SKK) for 12 years, then €0.08/kWh.
- Annual O&M Cost: 1.5% of initial CapEx.
- Performance Ratio (PR): 0.80.
- Discount Rate (r): 6%.
- Lifetime (n): 25 years.
Calculation Steps:
- Annual Generation: $E = 720 \text{ kWp} \times 1250 \text{ kWh/kWp} \times 0.80 = 720,000 \text{ kWh}$.
- Revenue Stream: Years 1-12: $720,000 \times 0.45 = €324,000$. Years 13-25: $720,000 \times 0.08 = €57,600$.
- Cost Stream: Year 0: -€600,000. Years 1-25: O&M = 1.5% of €1.2M = -€18,000/year.
- NPV Calculation: Discounting the annual net cash flows (Revenue - O&M) back to Year 0 and subtracting the initial net cost. In this simplified example, the high initial 12-year revenue would likely result in a strongly positive NPV for the subsidy case, while the no-subsidy case (initial cost €1.2M) might struggle to break even.
9. Future Applications & Development Directions
The landscape has evolved dramatically since this 2009 study. Future directions for Slovakia and similar markets include:
- Beyond Subsidies to Market Mechanisms: Transition from fixed feed-in tariffs to competitive auction systems for large-scale PV, as seen in most of the EU, to discover the true market price and drive down costs.
- Distributed Generation & Prosumers: Focus on rooftop solar for residential, commercial, and industrial buildings, enabled by net-metering or smart export tariffs, reducing grid transmission burdens.
- Hybrid Systems & Storage Integration: Coupling PV plants with battery energy storage systems (BESS) to provide dispatchable power, stabilize the grid, and capture higher price points during peak demand. The economic analysis must then incorporate storage CapEx and revenue from ancillary services.
- Agrivoltaics: Combining solar panel installation with agricultural land use, optimizing land productivity and potentially creating additional revenue streams for farmers.
- Green Hydrogen Production: Using excess solar electricity for electrolysis to produce hydrogen, creating a storable fuel for industry and transportation, a concept gaining traction in EU strategies.
- Digitalization & AI for O&M: Using drones, IoT sensors, and artificial intelligence for predictive maintenance, fault detection, and yield optimization, further reducing O&M costs and improving the Performance Ratio (PR).
The core economic framework from the paper remains essential but must be applied with contemporary cost data and expanded to model these more complex, integrated value propositions.
10. References
- Petrovič, P. (2008). [Source on Slovak energy prognosis - cited in original].
- Imriš, I., & Horbaj, P. (2002). [Source on Slovak energy mix - cited in original].
- Decree No. 2/2008 of the Regulatory Office for Network Industries (Slovakia).
- International Renewable Energy Agency (IRENA). (2023). Renewable Power Generation Costs in 2022. Abu Dhabi: IRENA. [Provides global benchmark data on plummeting solar PV costs].
- BloombergNEF (BNEF). (2023). New Energy Outlook 2023. [Provides forward-looking analysis on energy transition economics and technology trends].
- European Commission. (2019). Clean energy for all Europeans package. [Legislative framework driving EU energy policy, including support scheme design].
- Fraunhofer ISE. (2023). Levelized Cost of Electricity – Renewable Energy Technologies. [Authoritative and frequently updated LCOE calculations for Germany/Europe].
Core Insight
This paper isn't just an economic model; it's a stark revelation of Slovakia's renewable energy paradox. The state's 2030 targets scream ambition (800% RES growth!), yet the on-the-ground economics for solar whisper a different story: "Without significant state hand-holding, this transition doesn't pencil out." The analysis effectively proves that PV, despite its technical merits, remains a policy-driven asset class in Slovakia, not yet a market-driven one.
Logical Flow
The authors correctly establish the macro context (national targets, high PV costs) before drilling into the microeconomics of specific plant sizes. The logic is sound: compare three realistic capacities under two funding regimes. However, the flow stumbles by not explicitly modeling the post-subsidy, post-feed-in-tariff era. The 25-year panel life is mentioned, but the financial analysis seems truncated at the 12-year policy horizon, ignoring the potentially volatile merchant revenue period that follows—a critical flaw for a full lifecycle assessment.
Strengths & Flaws
Strengths: The paper's greatest strength is its practicality. It moves beyond theoretical potential and tackles the real investor question: "What's my return?" Using specific capacities and Slovakia's actual solar map data grounds the analysis. The clear dichotomy between the subsidy and no-subsidy scenarios is brutally honest about market realities.
Glaring Flaws: The analysis feels frozen in 2009. It misses the seismic shift that was already beginning: the global plummet in PV module prices. As documented by sources like the International Renewable Energy Agency (IRENA), solar PV module prices fell by over 90% between 2010 and 2022. A model based on pre-2009 cost structures is largely obsolete for assessing current profitability, though its framework remains valid. Furthermore, it treats the 50% subsidy as a given, without discussing its fiscal sustainability or the market-distorting effects of such high intervention, a topic widely debated in energy economics literature.
Actionable Insights
For Slovak policymakers in 2009, this paper was a clear directive: implement the proposed feed-in tariff swiftly and consider capital grants to kick-start the sector. For today's analyst, the lesson is about dynamic modeling. Any economic analysis of fast-evolving tech like solar must be sensitivity- tested against rapidly falling cost curves. The paper's framework should be updated with current LCOE data from BloombergNEF or IRENA, which now often shows grid parity for solar in many regions without need for 50% grants. The future of Slovak solar policy should focus on facilitating grid integration and exploring competitive auctions (like those used successfully in Germany and Portugal) rather than relying on fixed, high subsidies, to ensure cost-efficient capacity expansion.